Best Tools for Research Paper Figures (2026)
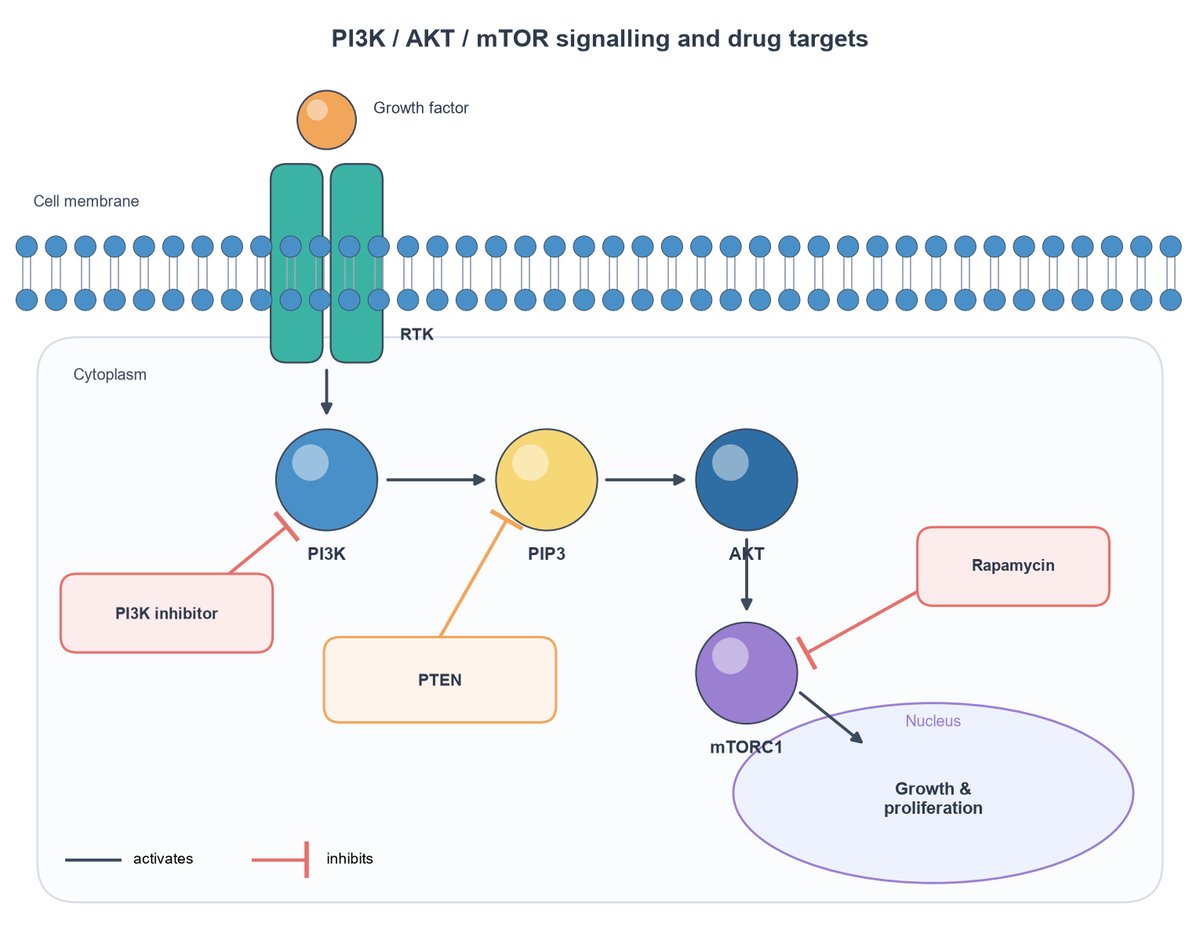
Short answer: use BioRender or SciFigures for biology diagrams and graphical abstracts, GraphPad Prism, R or Python for statistics and charts, and Inkscape for final vector edits. SciFigures covers both diagrams and journal-style charts, drawn with code, with a free plan.
Comparison
| Tool | Diagrams | Data charts | Editable vector | Free option |
|---|---|---|---|---|
| SciFigures | Yes (from text or sketch) | Yes (CSV/Excel) | SVG/PDF (paid plans) | 3 figures/month |
| BioRender | Yes (icon library) | Basic | Paid plans | Limited, watermark |
| GraphPad Prism | No | Yes, with statistics | Yes | Trial only |
| R (ggplot2) / Python (matplotlib) | Limited | Yes, fully flexible | Yes | Free, needs coding |
| Inkscape | Yes, by hand | No | Yes | Free |
| PowerPoint | Simple | Basic | Partly | With Office |
How to choose
- No time and no design skills: describe the figure in an AI-assisted tool, then check every label.
- Statistics-heavy papers: Prism, R or Python, so the analysis and the chart stay together.
- Final polishing: open the SVG in Inkscape or Illustrator.
Whatever you use, follow your journal's rules on image licences and on AI-assisted figures. See also free BioRender alternatives.
Make your figure nowDescribe it or upload a sketch. Free to start.
Open SciFigures
More guides
- How to Make a Graphical Abstract (Step by Step)
- Journal Figure Requirements: Size, DPI and File Formats
- How to Make Good Scientific Figures for Your Thesis
- Colour-Blind Friendly Colour Palettes for Scientific Figures
- How to Draw a Mechanism of Action Diagram
- How to Edit SVG Figures in PowerPoint, Illustrator and Inkscape
- Free BioRender Alternatives for Scientific Figures
- How to Fix AI-Generated Scientific Images Before Using Them
- How to Make a Volcano Plot (and Read One)
- How to Calculate IC50 from a Dose-Response Curve
- Kaplan-Meier Survival Curve Explained (with Example)
- Drug Release Kinetics Models: Zero Order, First Order, Higuchi, Korsmeyer-Peppas
- How to Make a Forest Plot for a Meta-Analysis
- SD vs SEM Error Bars: Which Should You Use?
- How to Draw a Research Methodology Flowchart
- Figures for a B.Pharm or M.Pharm Project and Thesis
- Free Scientific Figure Maker for a Thesis
- How to Make 300 DPI Figures for a Journal
- BioRender vs SciFigures: Which Should You Use?
- Best Free Graphical Abstract Makers (2026)
- Liposome Structure Diagram: How to Draw It Correctly
Popular tools
Graphical Abstract MakerTurn your paper's story into one clear visual summary for the journal submission system.Scientific Figure MakerMake clean, publication-quality figures for papers, theses and posters from a sketch or a sentence.Scientific Illustration MakerDraw polished scientific illustrations in a clean BioRender-like, journal or textbook style.Scientific Poster Figure MakerMake big, readable infographic panels for conference and research posters.Conceptual Framework Diagram MakerShow variables, relationships and hypotheses of your study in one tidy diagram.Biological Pathway Diagram GeneratorDraw metabolic and biological pathways with correct steps, enzymes and arrow directions.