Drug Release Kinetics Models: Zero Order, First Order, Higuchi, Korsmeyer-Peppas
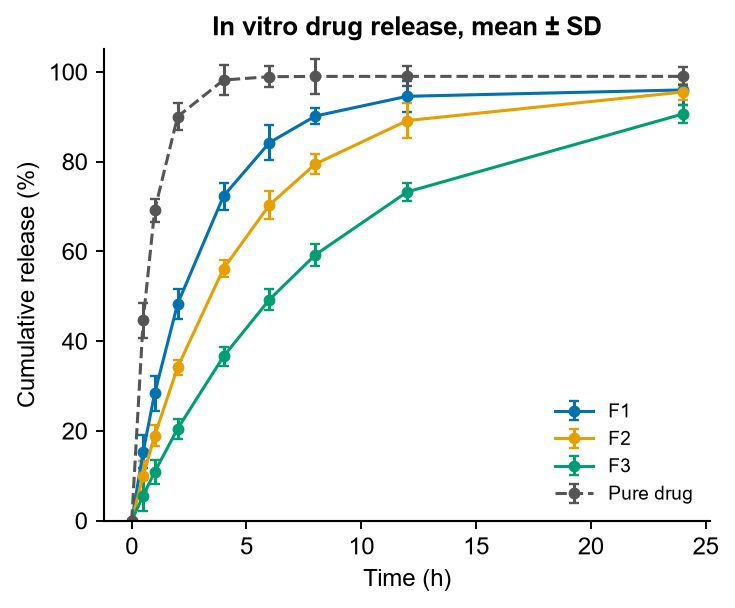
In vitro release data are usually fitted to several kinetic models, and the model with the highest R² (and a sensible mechanism) is reported. These are the models used most in pharmacy theses and papers.
Zero order
Qt = Q0 + K0t. Plot cumulative % released against time. The drug is released at a constant rate, as in ideal controlled-release systems such as some osmotic tablets and transdermal patches.
First order
log C = log C0 − Kt / 2.303. Plot log % drug remaining against time. The rate depends on how much drug is left, typical of many porous matrices with water-soluble drugs.
Higuchi
Q = KH √t. Plot cumulative % released against the square root of time. A straight line suggests diffusion-controlled release from a matrix.
Korsmeyer-Peppas
Mt/M∞ = K tn. Plot log cumulative % released against log time, using only the first 60% of release. The slope n hints at the mechanism. For a thin film: n ≤ 0.5 Fickian diffusion, 0.5 < n < 1 anomalous (non-Fickian) transport, n = 1 case II (relaxation) transport. For cylinders the limits are about 0.45 and 0.89, and for spheres about 0.43 and 0.85.
Hixson-Crowell
Q01/3 − Qt1/3 = KHCt. Used when the particle surface area and size change as the drug dissolves.
Plotting the release profile
- Show mean ± SD (n ≥ 3) at each time point, with formulations as separate lines.
- Include the pure drug as a reference.
- Give the release medium, temperature and method (for example dialysis bag, pH 7.4, 37 °C) in the legend.
Upload your release data to the Drug Release Profile tool for a journal-style plot.
More guides
- How to Make a Graphical Abstract (Step by Step)
- Journal Figure Requirements: Size, DPI and File Formats
- How to Make Good Scientific Figures for Your Thesis
- Colour-Blind Friendly Colour Palettes for Scientific Figures
- How to Draw a Mechanism of Action Diagram
- How to Edit SVG Figures in PowerPoint, Illustrator and Inkscape
- Free BioRender Alternatives for Scientific Figures
- How to Fix AI-Generated Scientific Images Before Using Them
- How to Make a Volcano Plot (and Read One)
- How to Calculate IC50 from a Dose-Response Curve
- Kaplan-Meier Survival Curve Explained (with Example)
- How to Make a Forest Plot for a Meta-Analysis
- SD vs SEM Error Bars: Which Should You Use?
- How to Draw a Research Methodology Flowchart
- Figures for a B.Pharm or M.Pharm Project and Thesis