Upload an AI-generated picture with messy labels, a rough sketch, or your data. SciFigures redraws it as a clean, scientifically checked figure: graphical abstracts, pathways, mechanisms, labelled diagrams and journal-style charts.
No drawing skills or design software needed.
Upload an AI-generated image, a screenshot or a photo of your notebook drawing. SciFigures keeps the layout and content, fixes spelling and scientific mistakes, and redraws it in a professional style.
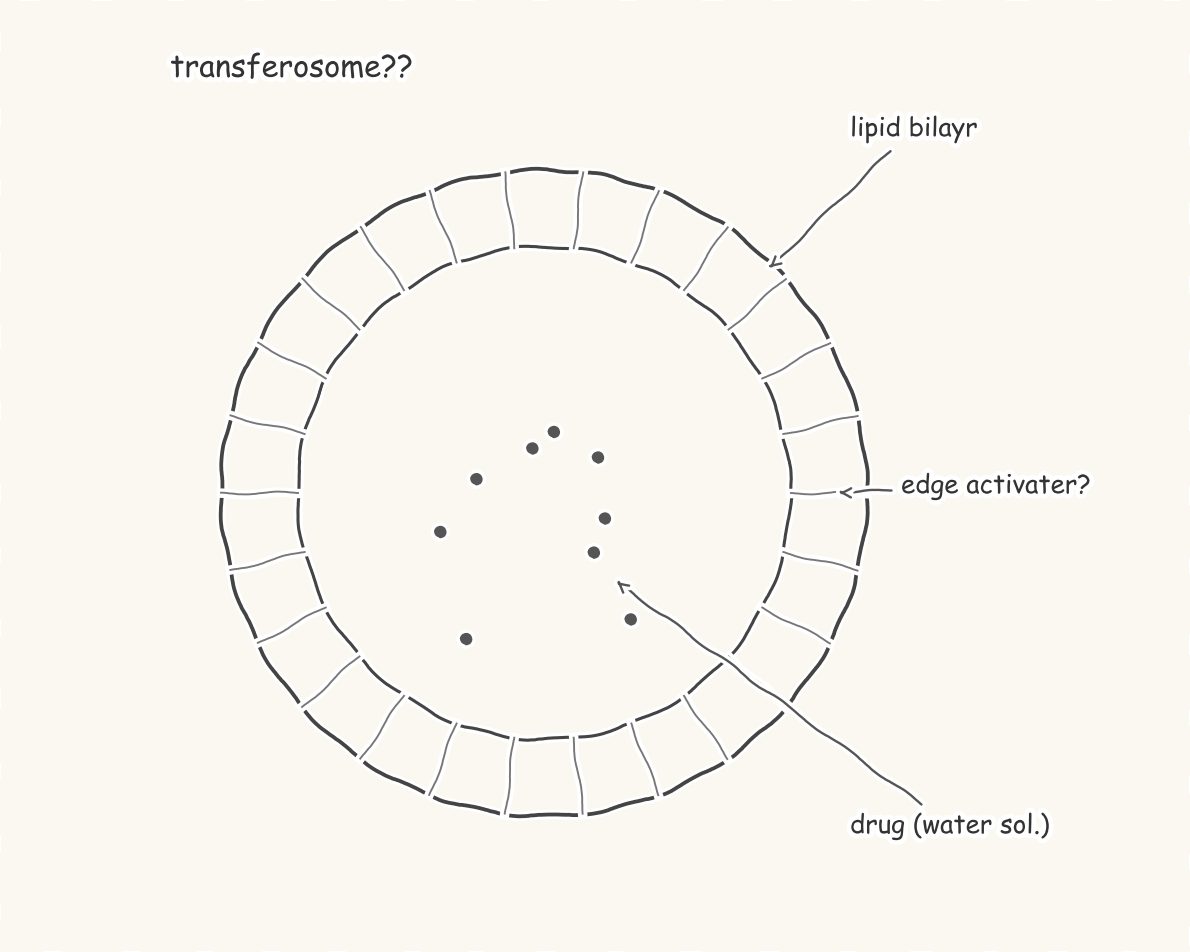
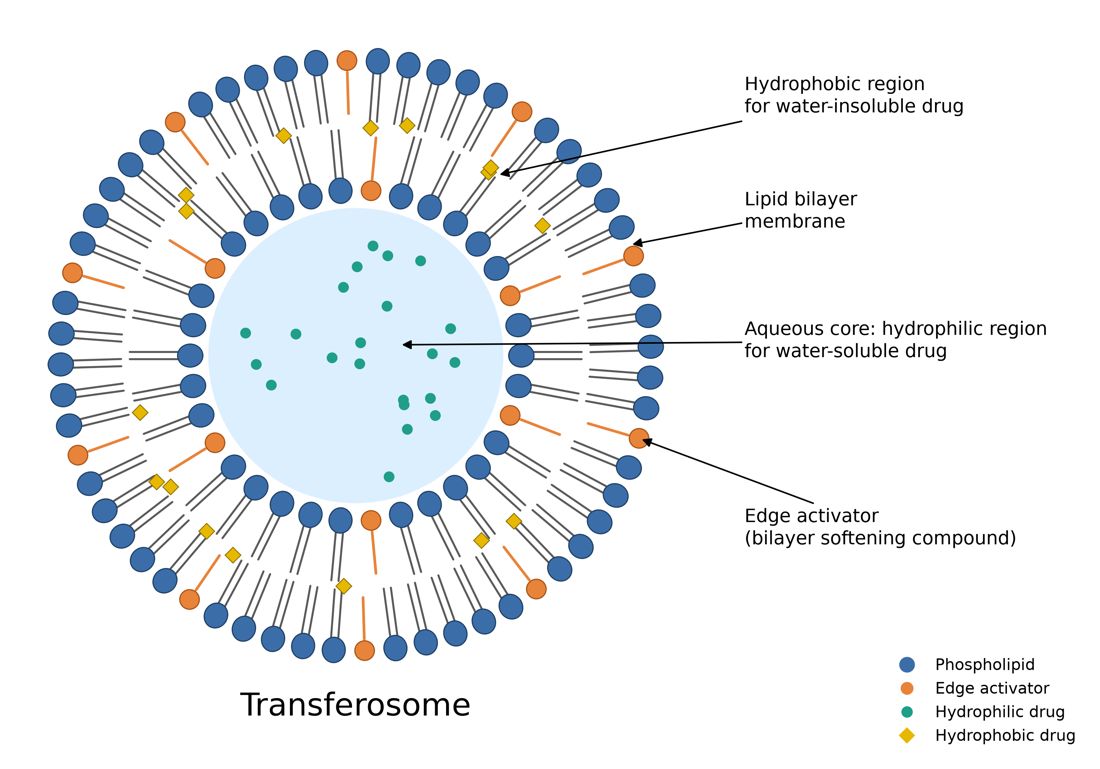
Images from general AI image tools often look nice but can't go into a paper. Upload them and get a figure you can actually publish.
Start from a template made for the figure you need. All tools →
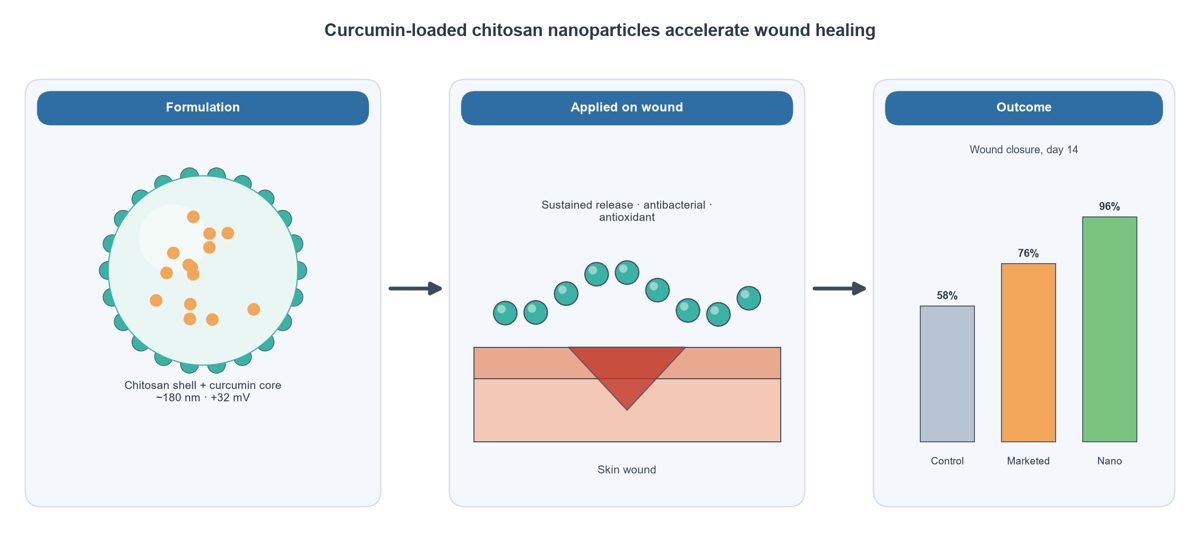 Graphical abstractStudy story left to right
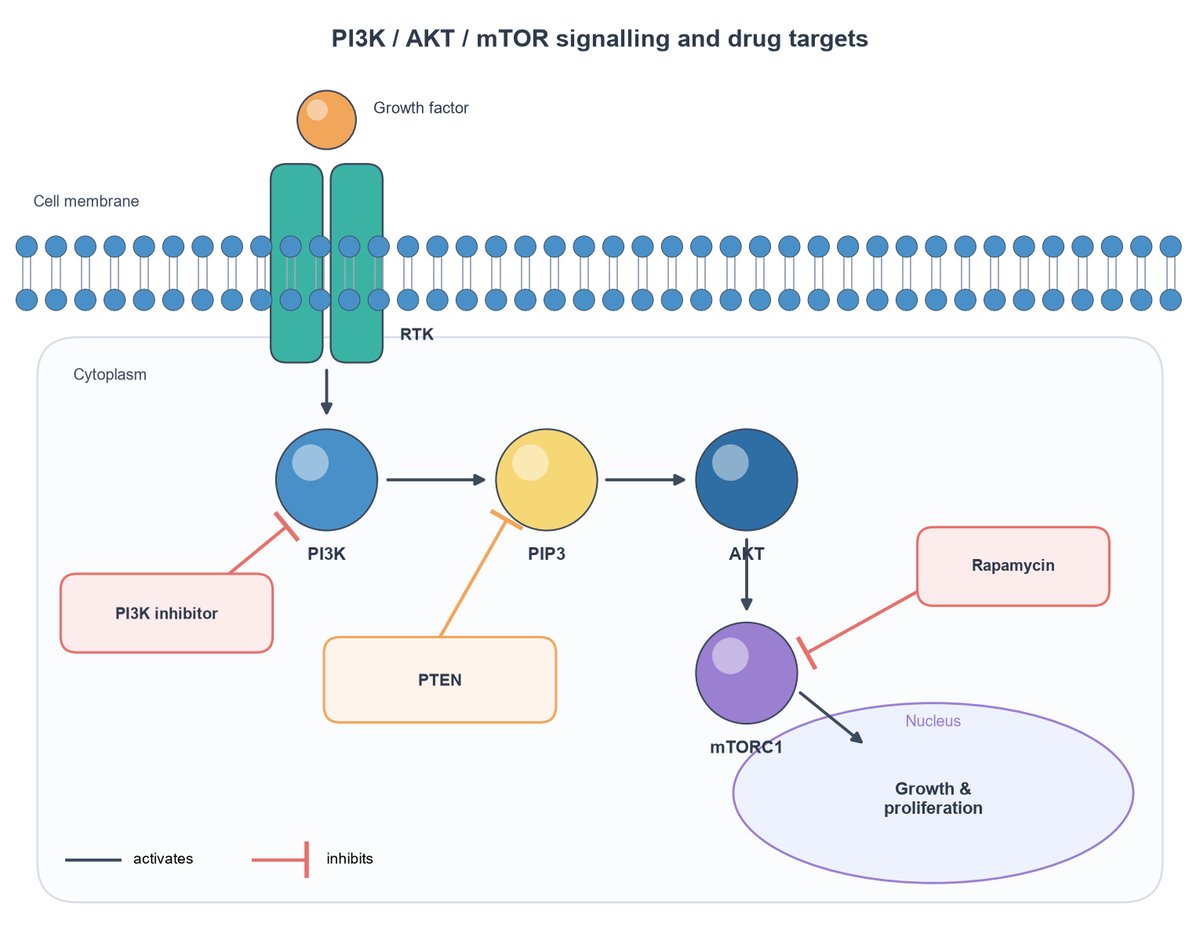 Signalling pathwayActivation & inhibition
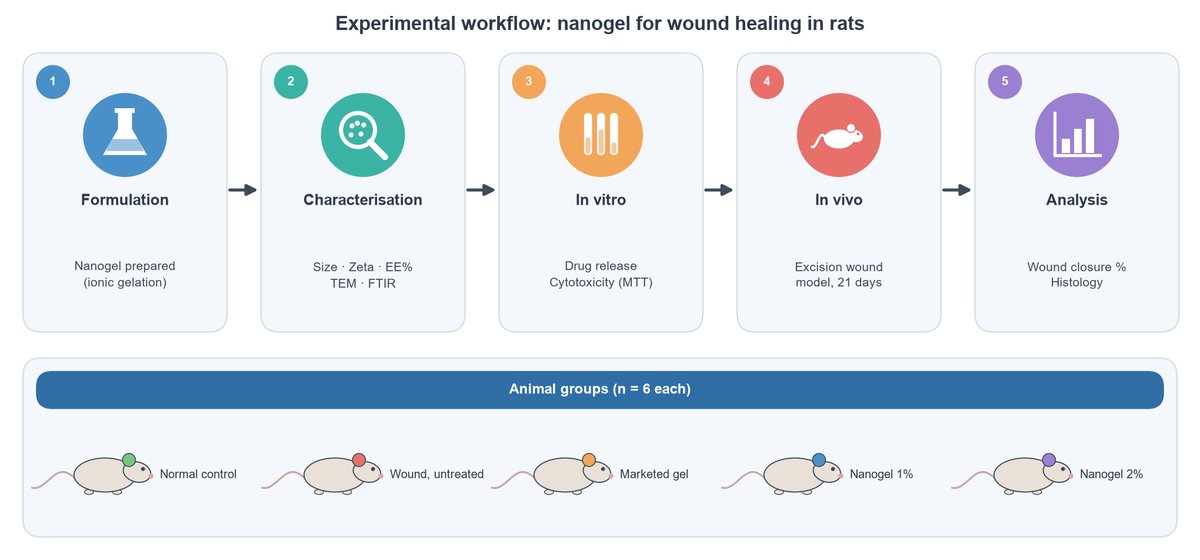 Experimental workflowMethods as a flowchart
Drug delivery systemLiposomes, nanoparticles
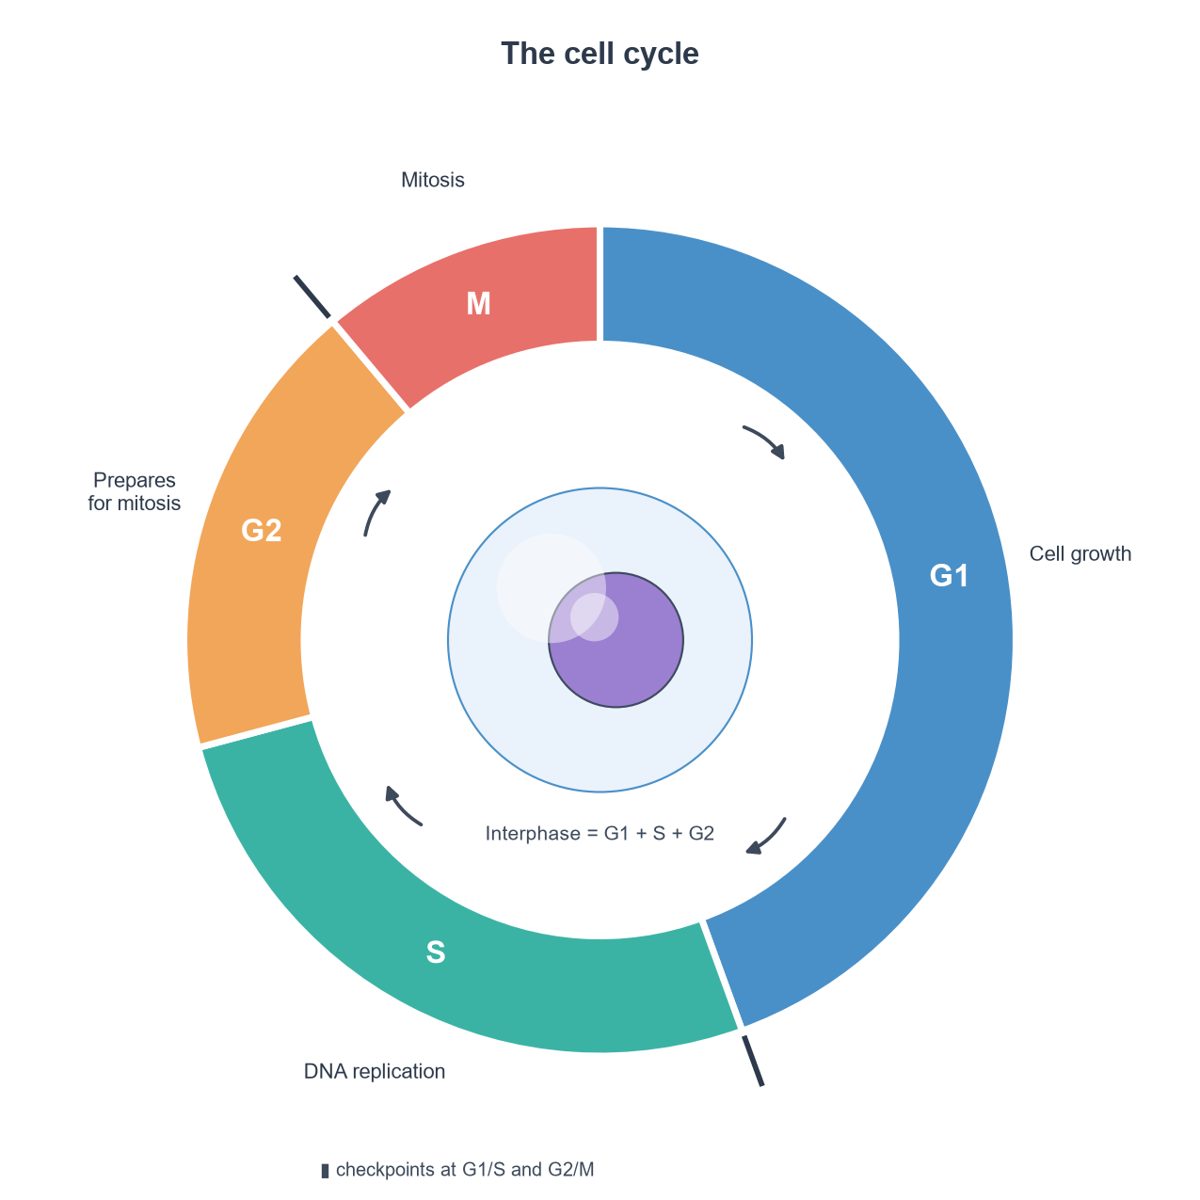 Cycle diagramCell cycle, Krebs, more
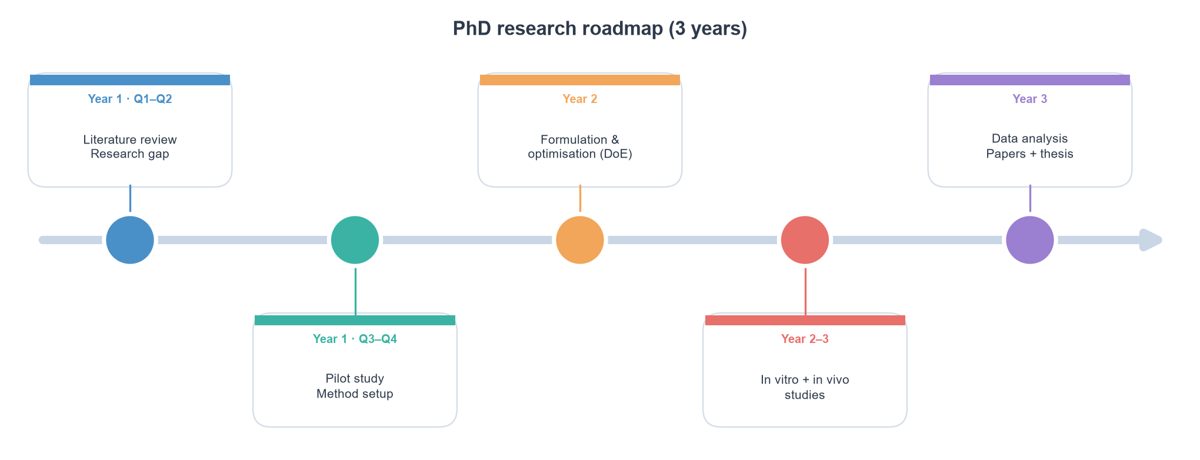 Research roadmapPhD plans, timelines
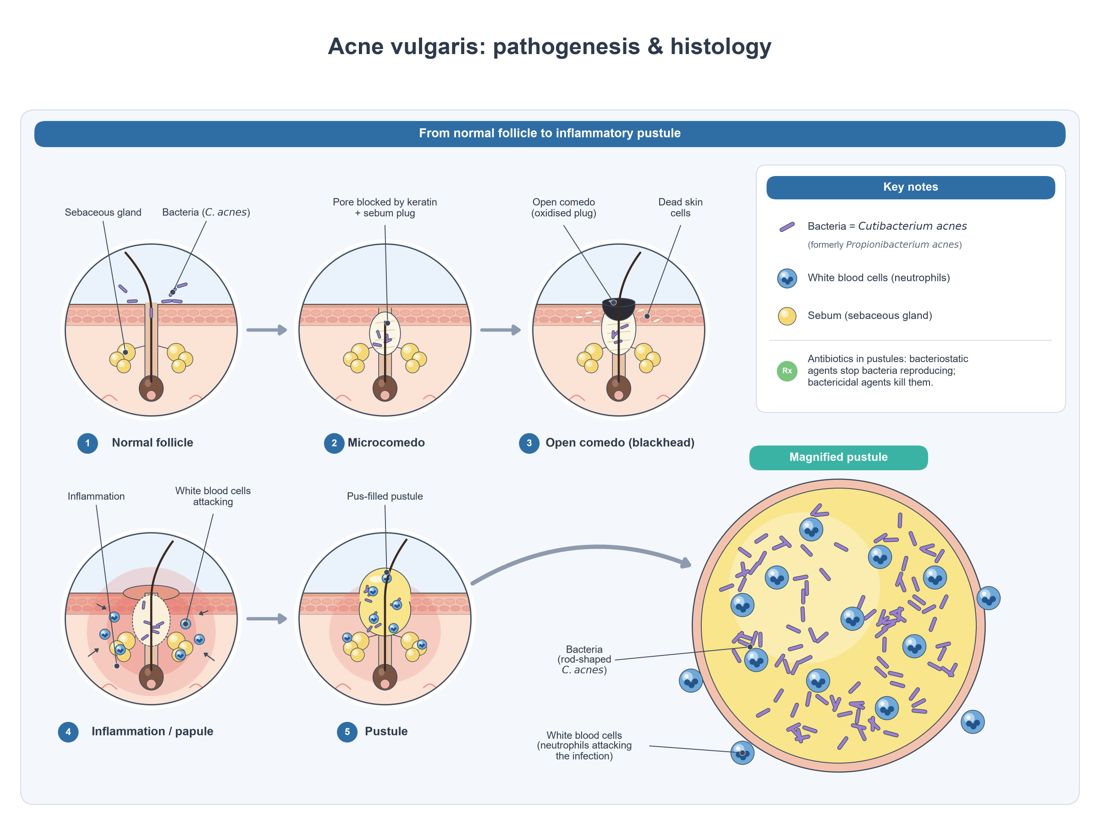 Disease processPathogenesis, histology
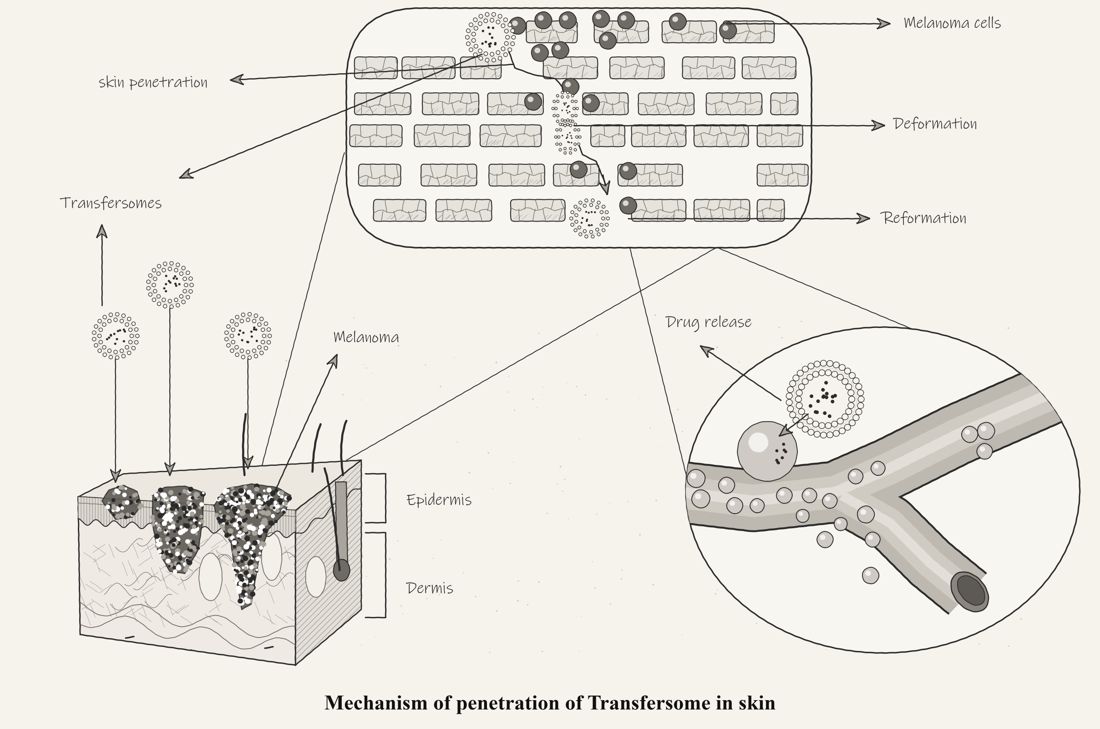 Hand-drawn styleNotebook sketch look
Upload CSV or Excel. Nature, Science, Cell, PLOS and ACS presets with colour-blind safe palettes.
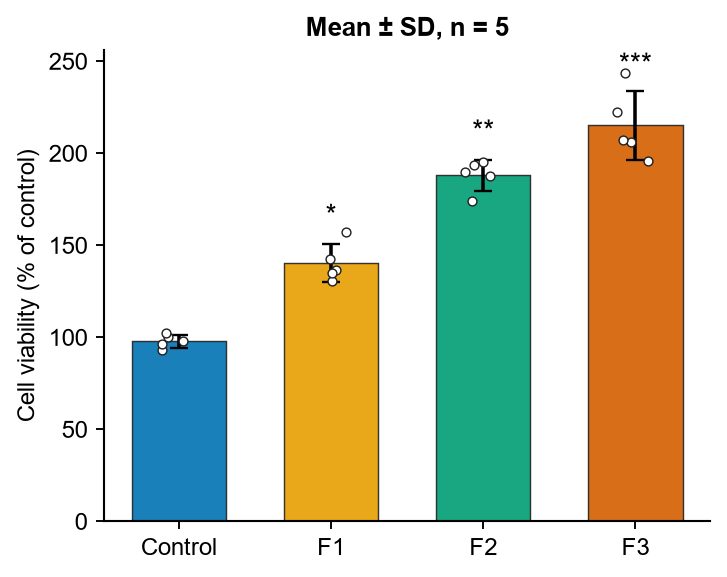 Bar + error barsMean ± SD with stars
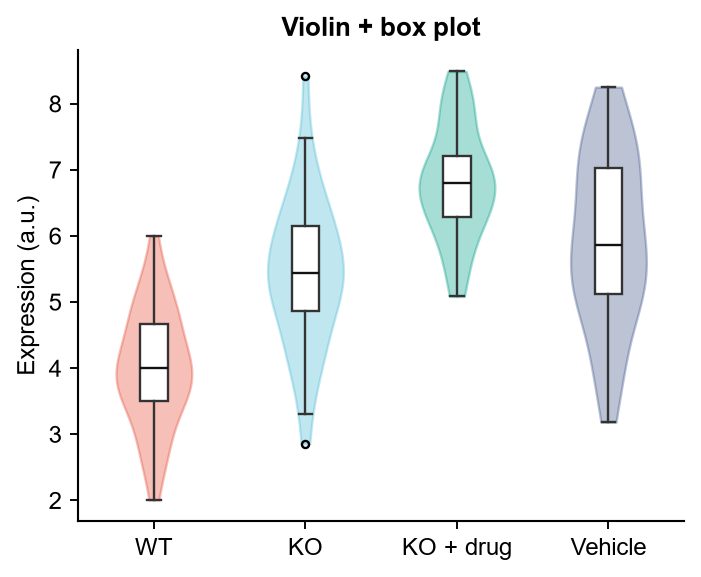 Violin + box plotFull distributions
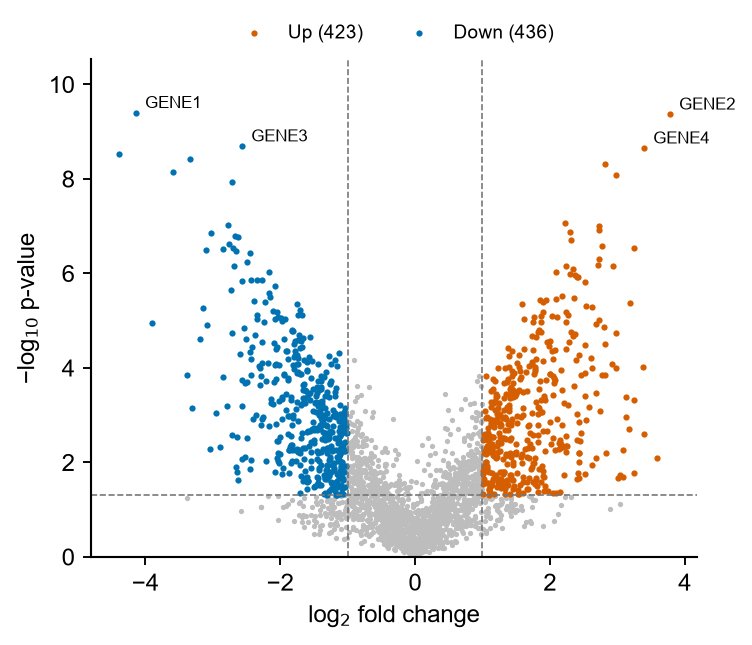 Volcano plotDifferential expression
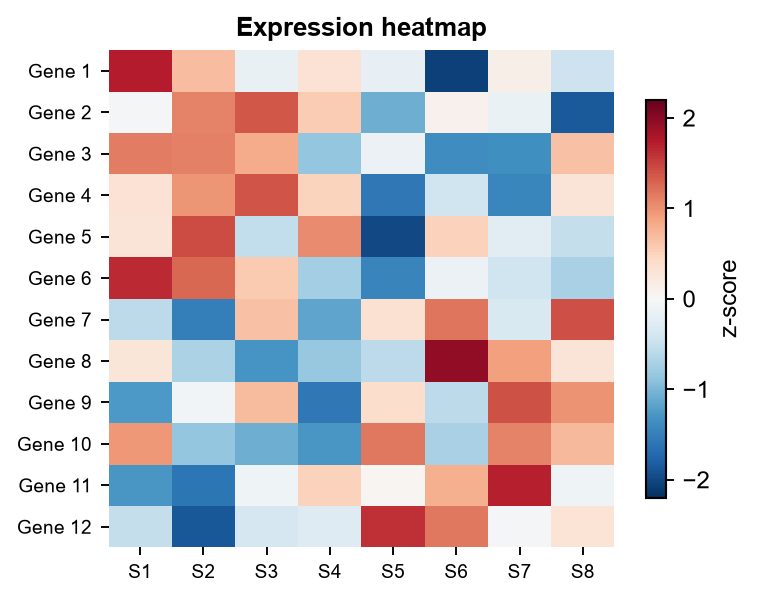 HeatmapExpression, correlation
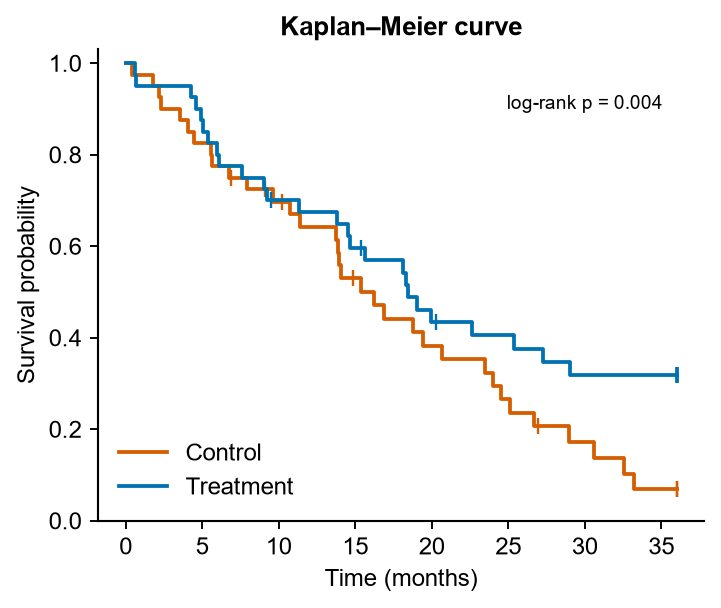 Kaplan–MeierSurvival with censoring
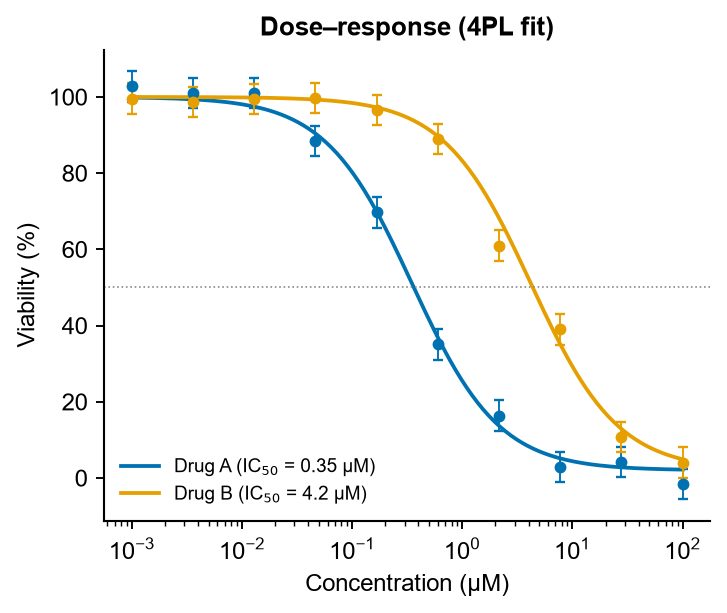 Dose–response4PL fit and IC50
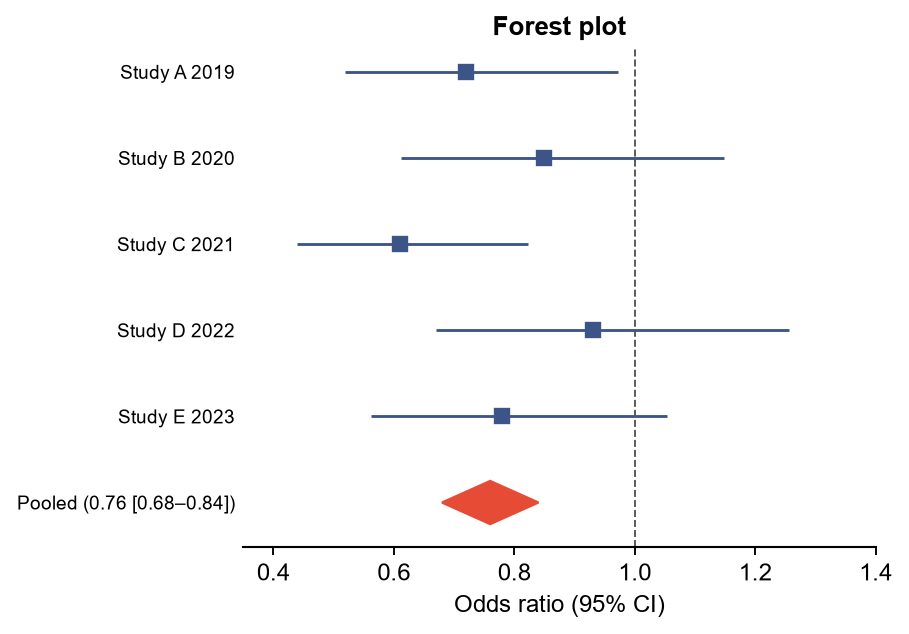 Forest plotMeta-analysis
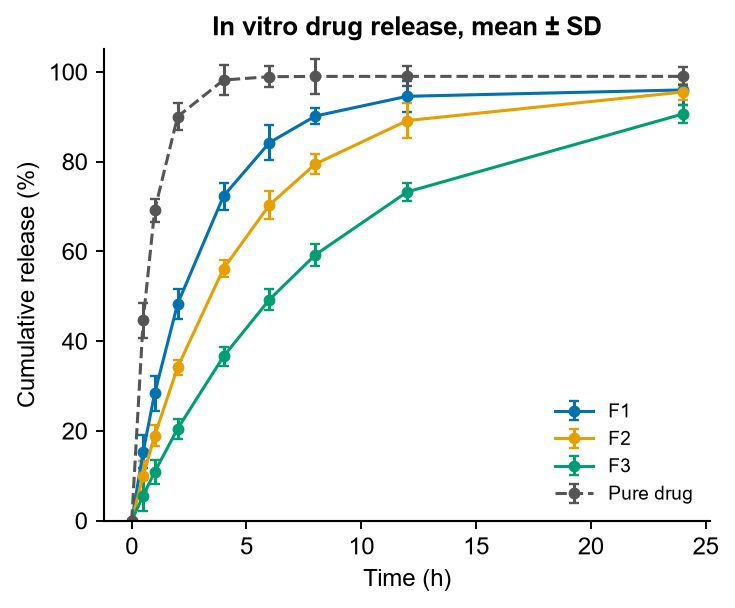 Drug release profileCumulative % release
Charts above use example data to show each chart type.
Every figure is drawn with code, so you get real vector files. Text stays text: open the SVG in PowerPoint (Insert → Convert to Shape), Illustrator or Inkscape and change any label or colour.
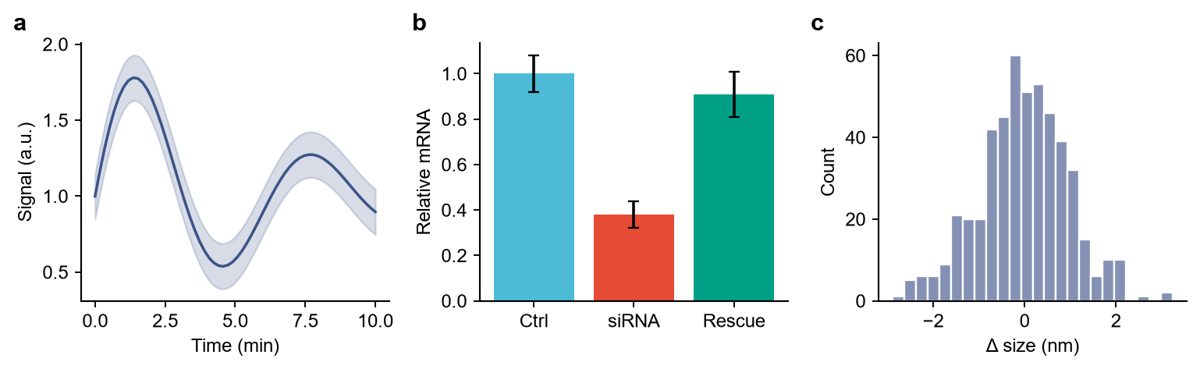
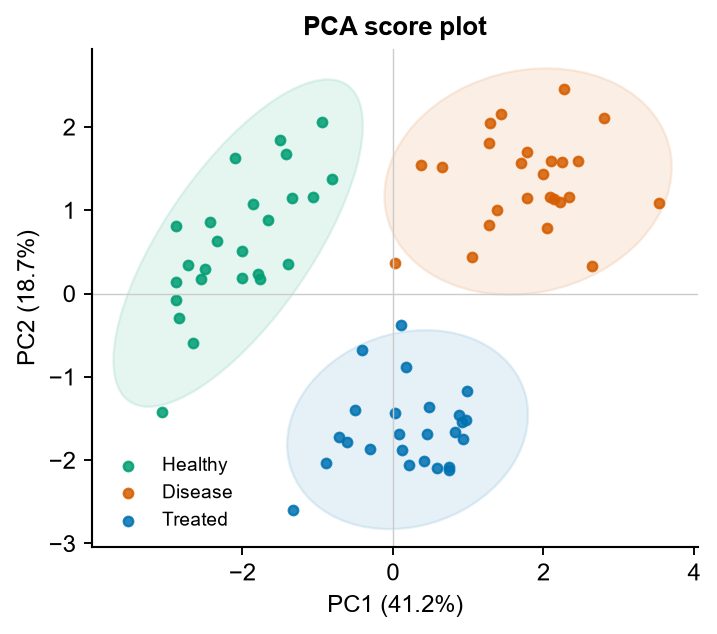
Labels are spell-checked; arrow directions, structures and units are reviewed before you see the figure.
Clean, journal minimal, textbook, hand-drawn, dark slide · abstract, mechanism, flowchart, cycle, timeline…
Upload a whole set at once, watch each finish, download all as a ZIP.
Uploads, data and figures are deleted from our server within an hour.
Every figure is a real drawing made by code, so it behaves like a figure you made yourself in a scientific plotting tool.
Labels are actual text, spell-checked and editable. No garbled AI lettering.
Download the Python code and redraw the exact figure any time, with your own data.
Uploads, data and figures are deleted from our server within an hour. It is sent only to our AI provider to make your figure, and never sold.
Figures are AI-assisted. Mention this where your journal or university asks, as you would for any tool.
Short, practical how-tos for papers, theses and posters.
Prompts, sketches, AI images and datasets turned into figures for manuscripts, theses, slides and teaching.
Turn rough signalling notes into a pathway diagram with compartments, correct arrows and readable labels, ready for a thesis chapter.
Describe the study in one sentence and get a left-to-right visual summary sized for the journal's submission system.
Upload a picture from a general AI image tool with misspelled labels and get a clean, correctly labelled figure back.
Liposome, niosome and nanoparticle diagrams with the drug in the right compartment, plus drug-release plots from Excel.
Go from a CSV file to box plots, volcano plots and heatmaps in a Nature or Cell style without writing code.
Make labelled cell, organ and cycle diagrams in a bright textbook style for slides, notes and exam revision.
Explain the experimental logic and work packages as a clean workflow or roadmap that reviewers understand quickly.
Monthly plans, cancel anytime. Every plan includes illustrations, data charts and edit-by-chatting.
Each new figure or edit counts as one figure. Failed figures are not counted. India: UPI, cards, netbanking (Razorpay). International: cards with taxes handled.
An AI scientific figure maker. You describe a figure, upload a sketch or an AI-generated image, or upload data, and it draws a clean, publication-ready figure with code. Then you can edit it by chatting.
A text description (English, Hindi or Hinglish), a photo of a hand-drawn sketch, a screenshot, an image made by another AI tool, or a CSV/Excel file for charts. You can upload many images at once.
Yes. Upload the image and say what it should show. SciFigures redraws it as a clean figure with correct, spell-checked labels and checked scientific details, at 300 dpi and as editable vector files on paid plans.
Usually in 1–4 minutes. Each edit takes about the same time.
They are made for it: 300 dpi PNG and TIFF, vector PDF and SVG, journal style presets and column sizes. Always check the figure yourself and follow your journal's figure and AI-disclosure rules.
Yes. You own the figures you make, including for theses, papers, posters, teaching and commercial work.
Use Illustration for diagrams, mechanisms, pathways, abstracts and redrawing images. Use Data chart when you have numbers in a CSV or Excel file.
Each new figure and each edit counts as one figure. Failed figures are not counted, and you can retry them.
No. Describe what you want in plain words. If something is off, ask for a change like you would ask a colleague.
No. Uploads, data and figures are deleted from our server within an hour, so download what you need.
UPI, cards and netbanking through Razorpay. Outside India, cards are accepted through our international checkout (taxes handled for you). Cancel anytime.
Email us at sjklabs.support@gmail.com with what you need.
Free to start. Describe it, sketch it, or upload your data.