How to Draw a Research Methodology Flowchart
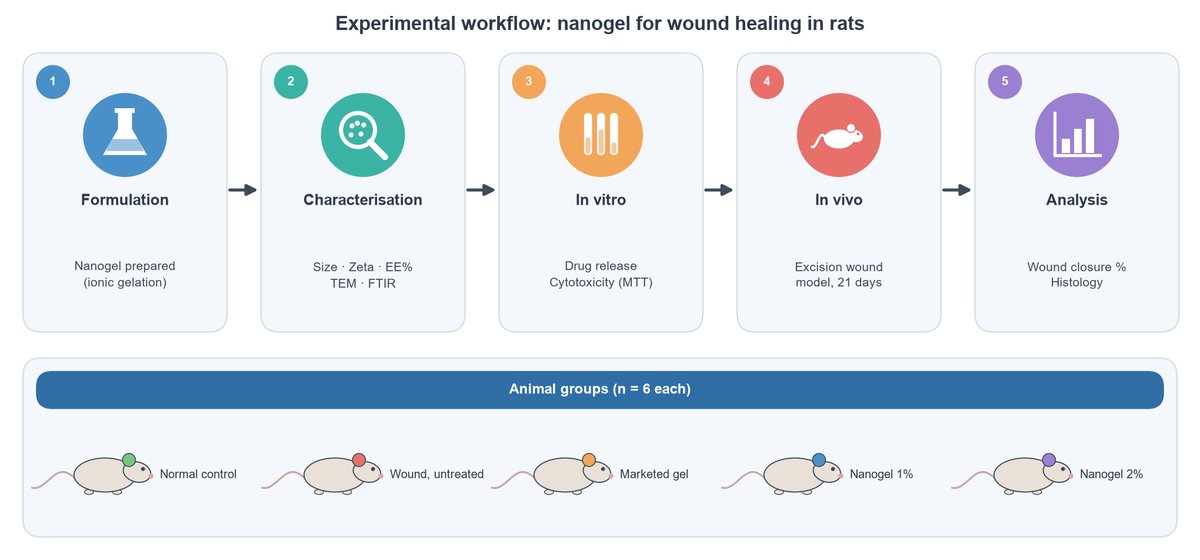
A methodology flowchart shows the reader your whole study at a glance: what you made, how you tested it and how you analysed the results. Examiners and reviewers love it because it saves them reading three pages.
1. List the stages
Write 4 to 6 stages in order, for example: formulation → characterisation → in vitro studies → in vivo studies → analysis. Each stage becomes one box.
2. Add the key details under each stage
Two or three short lines: the main tests or conditions (size, zeta potential, entrapment efficiency, MTT assay, 21-day wound model). Leave full methods to the text.
3. Show groups and numbers
For animal or clinical work, add a row with the groups and n per group. This answers the first question every reviewer asks.
4. Keep the design consistent
- One direction of flow (left to right, or top to bottom).
- One colour per stage, used again wherever that stage appears.
- Numbered steps and simple icons (flask, magnifier, test tube, animal, chart).
Describe your study in one paragraph in the Research Methodology Flowchart tool and it draws a figure like the example above.
More guides
- How to Make a Graphical Abstract (Step by Step)
- Journal Figure Requirements: Size, DPI and File Formats
- How to Make Good Scientific Figures for Your Thesis
- Colour-Blind Friendly Colour Palettes for Scientific Figures
- How to Draw a Mechanism of Action Diagram
- How to Edit SVG Figures in PowerPoint, Illustrator and Inkscape
- Free BioRender Alternatives for Scientific Figures
- How to Fix AI-Generated Scientific Images Before Using Them
- How to Make a Volcano Plot (and Read One)
- How to Calculate IC50 from a Dose-Response Curve
- Kaplan-Meier Survival Curve Explained (with Example)
- Drug Release Kinetics Models: Zero Order, First Order, Higuchi, Korsmeyer-Peppas
- How to Make a Forest Plot for a Meta-Analysis
- SD vs SEM Error Bars: Which Should You Use?
- Figures for a B.Pharm or M.Pharm Project and Thesis