Tools › Data charts

Box Plot Generator

Box plots with individual points, ready for publication.

Free figures every month · No card needed · Not stored on our server
1Upload your CSV or Excel file2Pick a journal style and colours3Download PNG/TIFF/PDF/SVG + code
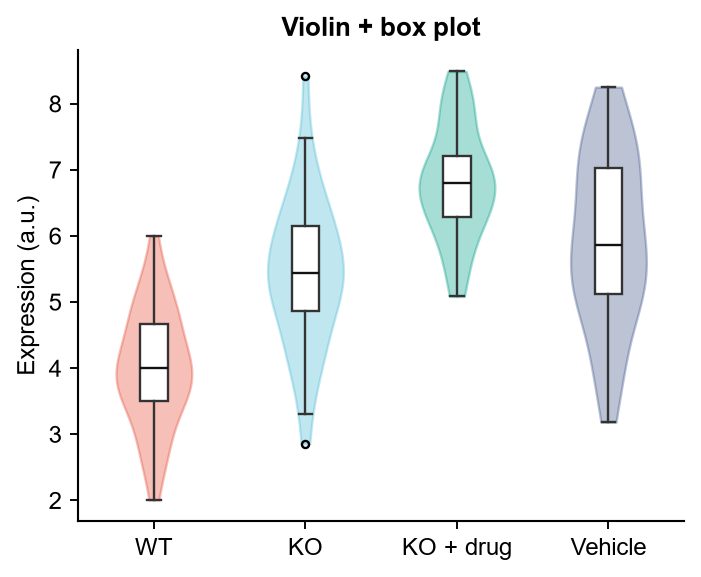
Box Plot Generator example made with SciFigures: Box plots with individual points, ready for publication.
Example chart (example data)

What it's good for

Try an example

Click one to open it in the app (you can edit the text).

Questions

What data format do I need?

A CSV or Excel (.xlsx) table with column headers. One row per observation or per group both work; just describe what you want.

Is it free?

Yes, you get free figures every month without a card. Paid plans give more figures, no watermark, and PNG + TIFF + PDF + editable SVG + the Python code.

Can I use the figures in a journal paper or thesis?

Yes. You own the figures you make. Figures are made with AI assistance, so check them carefully and follow your journal's policy on disclosing AI-assisted figure preparation.

Do you store my images or data?

No. Uploads and figures are deleted from our server within an hour. Download what you need.

Related tools