Tools › Data charts

Scatter Plot with Regression

Scatter plots with regression line, equation and R².

Free figures every month · No card needed · Not stored on our server
1Upload your CSV or Excel file2Pick a journal style and colours3Download PNG/TIFF/PDF/SVG + code
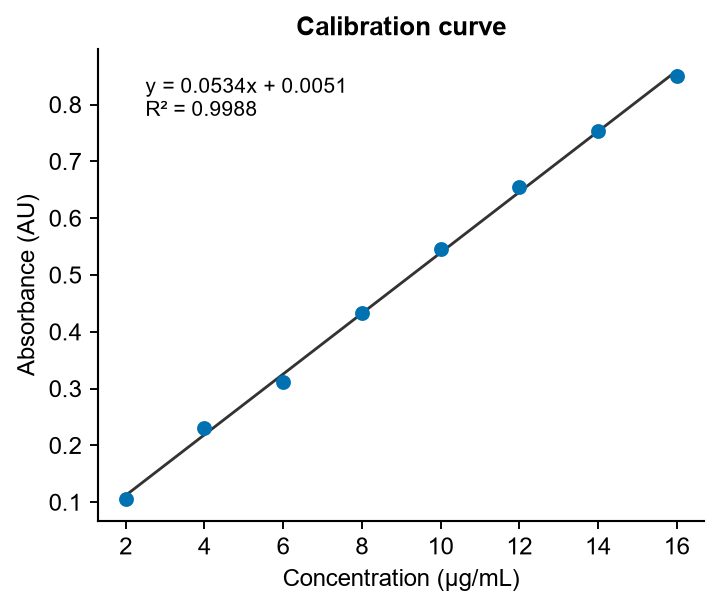
Scatter Plot with Regression example made with SciFigures: Scatter plots with regression line, equation and R².
Example chart (example data)

What it's good for

Try an example

Click one to open it in the app (you can edit the text).

Questions

What data format do I need?

A CSV or Excel (.xlsx) table with column headers. One row per observation or per group both work; just describe what you want.

Is it free?

Yes, you get free figures every month without a card. Paid plans give more figures, no watermark, and PNG + TIFF + PDF + editable SVG + the Python code.

Can I use the figures in a journal paper or thesis?

Yes. You own the figures you make. Figures are made with AI assistance, so check them carefully and follow your journal's policy on disclosing AI-assisted figure preparation.

Do you store my images or data?

No. Uploads and figures are deleted from our server within an hour. Download what you need.

Related tools