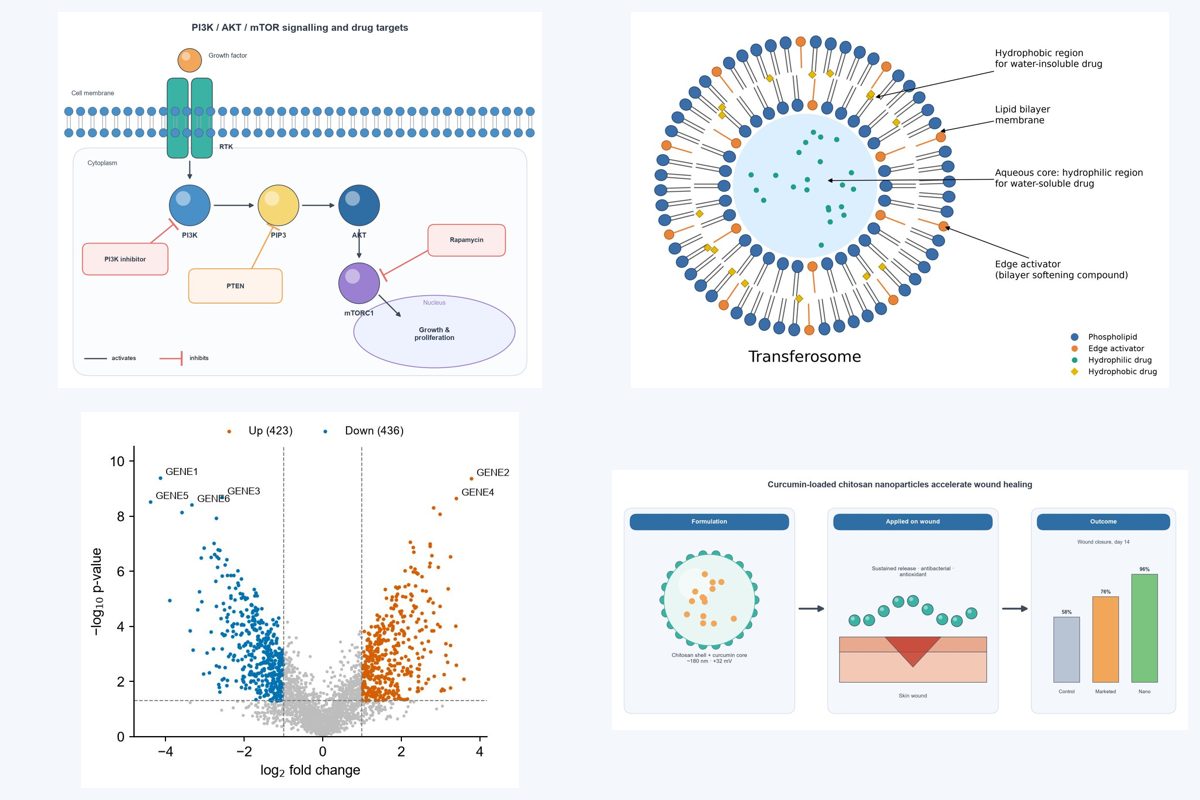
What it's good for
- Correct structures and labels, spell-checked
- Clean, textbook or journal style
- Edit by chatting, export PNG/TIFF/PDF/SVG
Try an example
Click one to open it in the app (you can edit the text).
Questions
Can it do the statistics?
It computes common statistics (mean, SD/SEM, t-tests, ANOVA, regressions, IC50 fits) in Python and shows what was used. Always check the method matches your study. SciFigures is independent and not affiliated with GraphPad.
Is it free?
Yes, you get free figures every month without a card. Paid plans give more figures, no watermark, and PNG + TIFF + PDF + editable SVG + the Python code.
Can I use the figures in a journal paper or thesis?
Yes. You own the figures you make. Figures are made with AI assistance, so check them carefully and follow your journal's policy on disclosing AI-assisted figure preparation.
Do you store my images or data?
No. Uploads and figures are deleted from our server within an hour. Download what you need.
Related tools