SD vs SEM Error Bars: Which Should You Use?
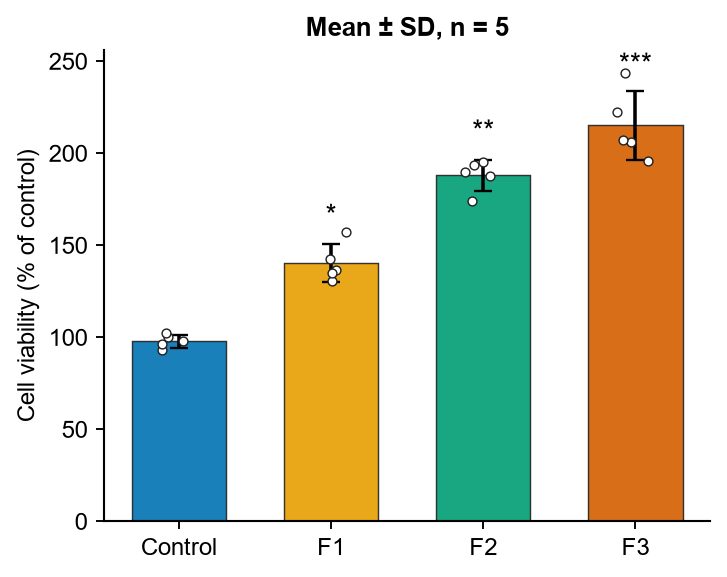
Error bars are one of the most common sources of reviewer comments. The key is to know what each kind means and to say which one you used.
Standard deviation (SD)
Shows how spread out the individual values are. Use it when you want to show the variability of your data, for example the spread of particle sizes or of cell viability between wells.
Standard error of the mean (SEM)
SEM = SD / √n. It shows how precisely you know the mean, and it shrinks as n grows. SEM bars look smaller than SD bars, so using them only to make data look tidier is misleading.
95% confidence interval (CI)
About ±1.96 × SEM for large samples. It is often the most useful choice when comparing groups, because it shows the likely range of the true mean.
Good practice
- Always state in the legend which one you used and the value of n, for example "mean ± SD, n = 5".
- With small n (under about 10), show the individual data points on top of the bars or use a dot plot.
- Mark significance with stars or exact p-values and name the test (for example one-way ANOVA with Tukey's test).
The Bar Chart with Error Bars tool shows individual points and significance stars by default.
Make your figure nowDescribe it or upload a sketch. Free to start.
Open SciFigures
More guides
- How to Make a Graphical Abstract (Step by Step)
- Journal Figure Requirements: Size, DPI and File Formats
- How to Make Good Scientific Figures for Your Thesis
- Colour-Blind Friendly Colour Palettes for Scientific Figures
- How to Draw a Mechanism of Action Diagram
- How to Edit SVG Figures in PowerPoint, Illustrator and Inkscape
- Free BioRender Alternatives for Scientific Figures
- How to Fix AI-Generated Scientific Images Before Using Them
- How to Make a Volcano Plot (and Read One)
- How to Calculate IC50 from a Dose-Response Curve
- Kaplan-Meier Survival Curve Explained (with Example)
- Drug Release Kinetics Models: Zero Order, First Order, Higuchi, Korsmeyer-Peppas
- How to Make a Forest Plot for a Meta-Analysis
- How to Draw a Research Methodology Flowchart
- Figures for a B.Pharm or M.Pharm Project and Thesis
Popular tools
Graphical Abstract MakerTurn your paper's story into one clear visual summary for the journal submission system.Scientific Figure MakerMake clean, publication-quality figures for papers, theses and posters from a sketch or a sentence.Scientific Illustration MakerDraw polished scientific illustrations in a clean BioRender-like, journal or textbook style.Scientific Poster Figure MakerMake big, readable infographic panels for conference and research posters.Conceptual Framework Diagram MakerShow variables, relationships and hypotheses of your study in one tidy diagram.Biological Pathway Diagram GeneratorDraw metabolic and biological pathways with correct steps, enzymes and arrow directions.